Statistical Studying
Statistical Studying
Statistical Studying
data visualization
data visualization
data visualization
Examining my productivity at various study spots through experimental and interactive data visualization.
Examining my productivity at various study spots through experimental and interactive data visualization.
Examining my productivity at various study spots through experimental and interactive data visualization.
Examining my productivity at various study spots through experimental and interactive data visualization.
3D Interaction
Data Visualization
Tools: Spline, Illustrator, Photoshop
Tools: Spline, Illustrator, Photoshop
Tools: Spline, Illustrator, Photoshop
challenge
challenge
challenge
the ideal
study spot
the ideal
study spot
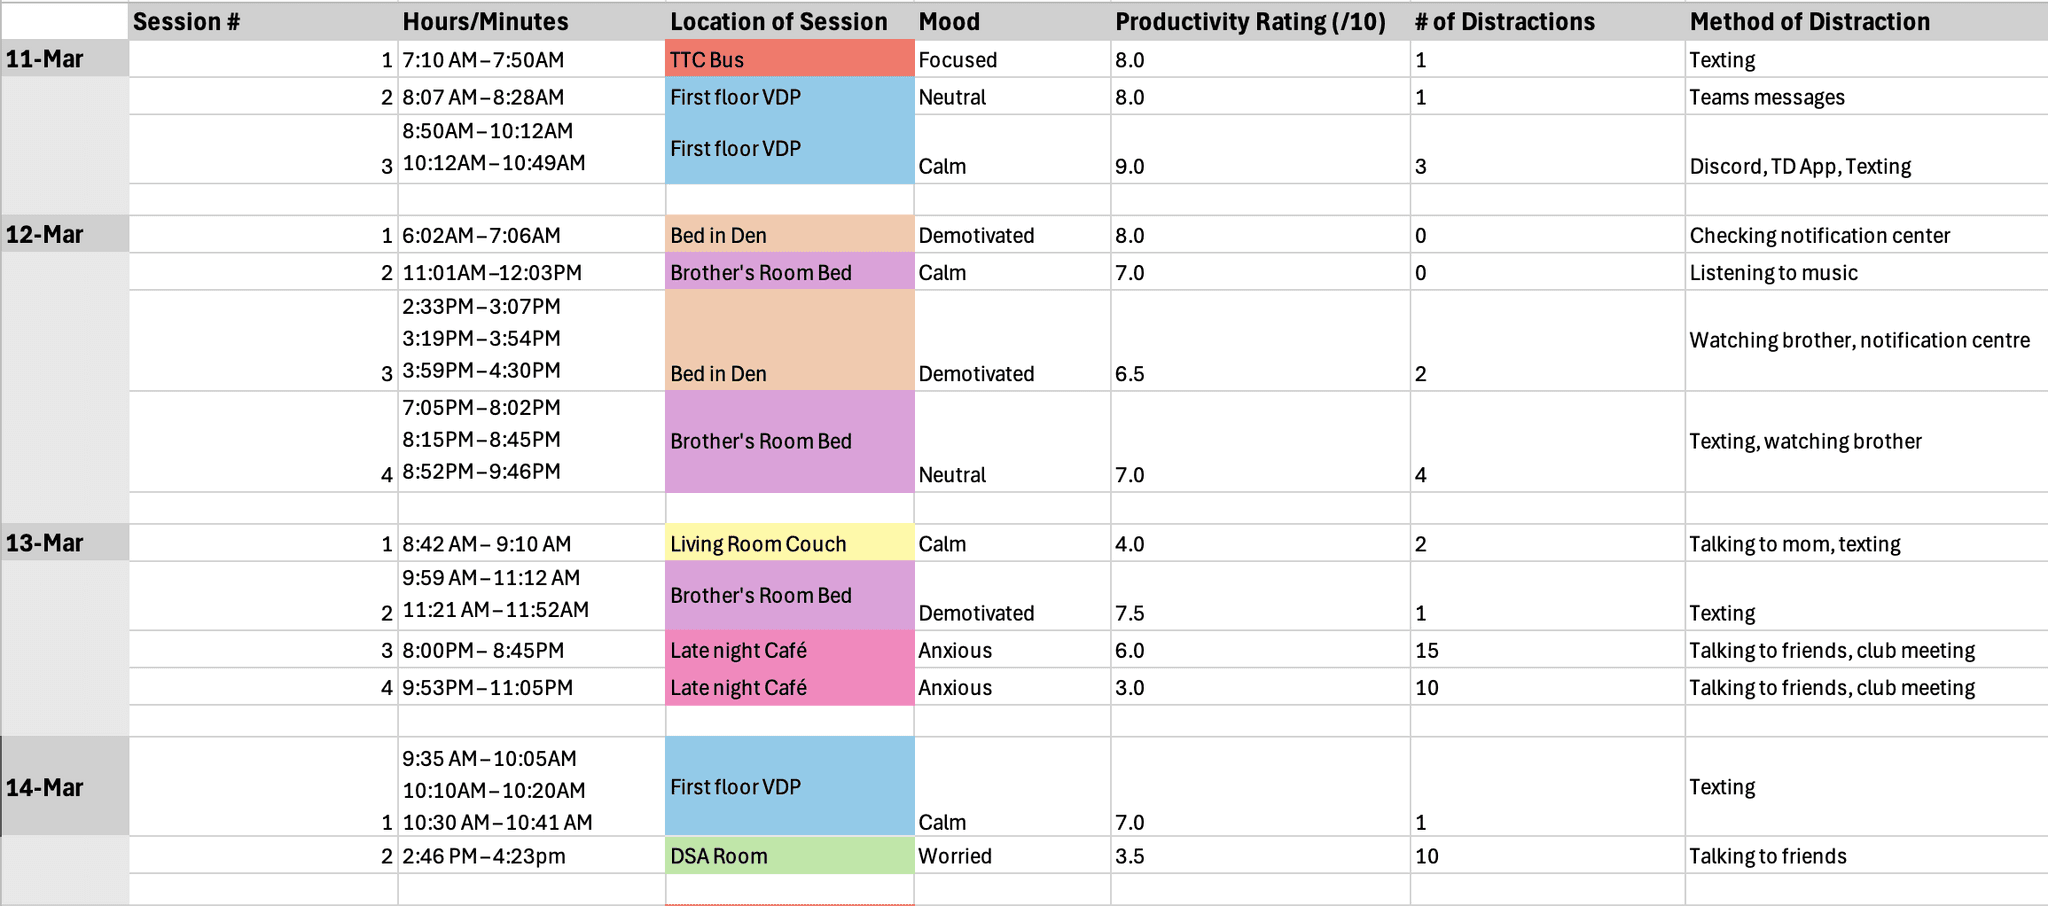
I study at a various locations during the school semester; but how does each location impact me and my productivity?
By analyzing data on my studying locations over a ten-day period, I understood the impact of the locations on my productivity and the qualities that make for an ideal study location.
I study at a various locations during the school semester; but how does each location impact me and my productivity?
By analyzing data on my studying locations over a ten-day period, I understood the impact of the locations on my productivity and the qualities that make for an ideal study location.

story
story
a peak into my
study life
a peak into my
study life
I experimented with Spline to take the collected data and provide an immersive interactive experience that enables viewers to make up conclusions of the data themselves. I made the visualization to place an emphasis on productivity vs. time-spent while allowing further metrics of each spot to be viewed.
I experimented with Spline to take the collected data and provide an immersive interactive experience that enables viewers to make up conclusions of the data themselves. I made the visualization to place an emphasis on productivity vs. time-spent while allowing further metrics of each spot to be viewed.
Productivity vs. Time Spent Overview
Productivity vs. Time Spent Overview
Ability to quickly examine the productivity of various locations against the time spent at that location. Hovering over locations provide exact values on grid.
Ability to quickly examine the productivity of various locations against the time spent at that location. Hovering over locations provide exact values on grid.
Details of Location
Details of Location
Click location to view location name, further statistics of location, and ranking among other locations.
Click location to view location name, further statistics of location, and ranking among other locations.
Graph View
Graph View
Graph view enables productivity and time spent metrics to be viewed in graph form to be quickly compared.
Graph view enables productivity and time spent metrics to be viewed in graph form to be quickly compared.
results
results
data and 3D interaction
data and 3D interaction
This project gave me the chance to collect, examine, and visualize my own data set. The freedom to visualize my data in any manner allowed me to experiment with 3D interaction and get a better grasp of the Spline software.
This project reinforced to me the amazing results that are capable through collaborative design work. As a group we stayed organized and diligent to seamlessly move through the design process from research, to building screens and prototyping. As the unofficial leader, we devised work based on strengths and interests and set clear brand guidelines to ensure visual consistency regardless of the designer. More significantly, this project reminded me how rewarding and fun working in a team can be!
let's chop it up!
(that's what the cool kids say right?)
let's chop it up!
(that's what the cool kids say right?)